When I was in high school, I was assigned a summer reading book for a math class: How to Lie with Statistics. First off, how sadistic is it to assign summer reading for a math class? But secondly, that title really stuck with me! It is super easy to lie with statistics. And as a result, I don’t trust statistics. But now I find myself occasionally needing to make an infographic. And infographics are all about statistics.
Well, infographics are officially ON TREND.
Why, you ask?
Find out one weird trick that will increase your SEO and bring thousands of clicks to your website.
See what I did there? That’s what you call “clickbait.” And infographics are clickbait—or, more accurately, sharebait. People love sharing infographics. Look at them. They’re so pretty. They have a lot of facts (“facts”?) and pie charts and bar graphs. They’re the more sophisticated version of photos of cats doing cute things.
But years of Catholic school and that How to Lie with Statistics book have ensured that I can’t just create an infographic willy nilly. I have to painstakingly research statistics and cite them properly. It can be pretty time consuming, so you have to ask yourself if it’s worth your time and/or money. Will it generate conversions? By that, I mean: will your infographic generate traffic to your website that results in users contacting you to purchase your products or services? It may, if it’s relevant and appropriate.
Here are 5 rules for creating a good infographic:
- Make it pretty. No one’s going to share your infographic if it uses 10 different fonts and clip art circa 1995.
- Make it pithy. People will not read a big block of text. I read at least 100 books per year, and even I don’t want to read a big block of text in the context of an infographic.
- Make it funny. These infographics are being shared by humans, not machines. And humans like to laugh. Making it funny will make it more likely to go viral.
- Make it shareable. Uploading an infographic to a friends-only Facebook post = not shareable. Uploading to Pinterest = highly shareable!
- A point of pride—make it accurate! Be part of the solution!
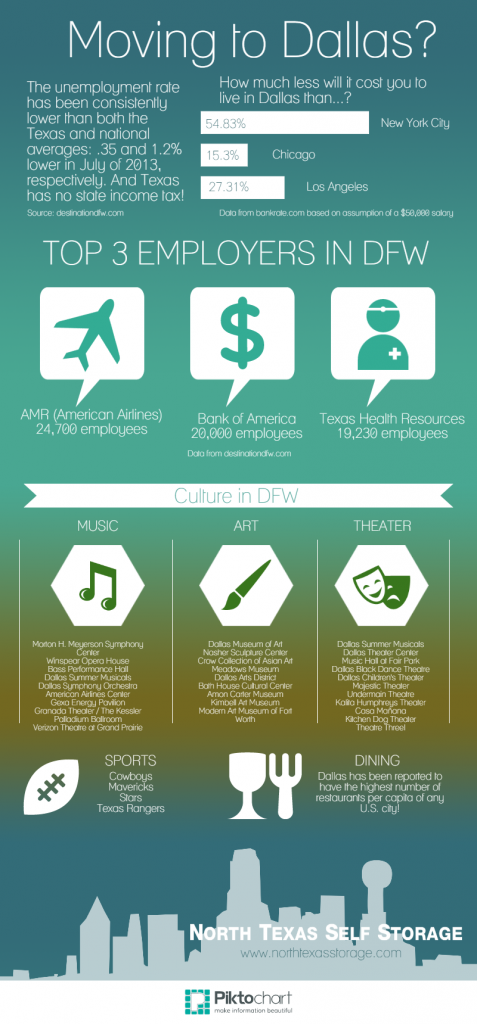
There are some great tools out there to make infographics, and one that I particularly like it piktochart.com. Here’s one I made on the topic of moving to Dallas, using one of their templates and several graphics I made myself. Even using a pre-existing template, I still had to use a bit of Adobe Illustrator and Photoshop, but still, it was much faster than starting from scratch!
If you don’t have several hours to create an infographic, or you don’t know if you need an infographic, just drop us a line!